BI and Analytics
Business Strategy
Article
Success Stories
69423799-6259-4d81-b922-393b3d3ca3d1
5 min
https://edge.sitecorecloud.io/tessituraneab9a-tessiturane5642-staging-5396/media/Images/Stock-Photography/arm-laptop-768x465.jpg?h=465&iar=0&w=768
Data and business intelligence are too important to leave in someone else’s hands.
Take control of your data

Director of Marketing & Communications, Tessitura Network
Take control of your data
11/1/2019
5 min
How well do you know your data?
How easily can you access important metrics?
Are you using those key metrics in your decision-making?
If you don’t feel confident in your answers to those questions, it’s time to take control of your data and reporting.
Bringing information in-house
“We came from an organization that we depended on for information,” says Denise Smithson Green, Director of Ticketing at Des Moines Performing Arts. “And then when we transitioned into Tessitura, the ticket office became the place to go for all data and information to make data-informed decisions.”
Being the go-to department is a responsibility — and also a big opportunity.
“We can pull different types of reporting that give us the data we need, right at our fingertips,” Denise says, “rather than having to wait for someone to get that information to us, or maybe even not ever have access to it.” For example, “We were able to scrub our lists by using the reporting that we had” in-house, rather than needing to collaborate externally.
With Tessitura Analytics, a powerful business intelligence tool released in 2018, Tessitura has made arts organizations’ data more accessible, discoverable, and actionable than ever. Visual dashboards make the data easy to understand at a glance, and any data point can be clicked on for deeper analysis.
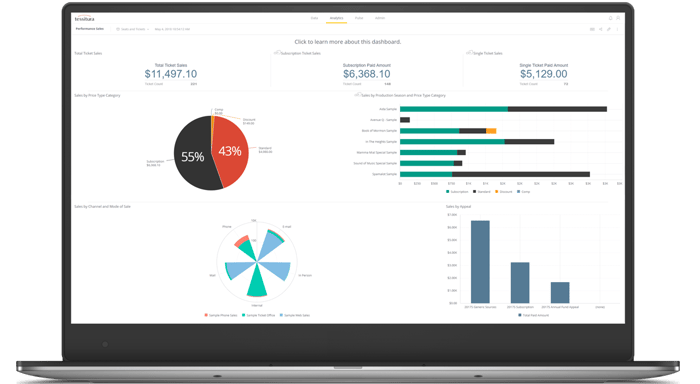
An example of an interactive Tessitura Analytics dashboard. Any metric can be clicked on for more in-depth exploration.
Smithson Green loves the visual aspect. “Tessitura Analytics brings a lot of validity to the work that we do. And it’s not just lip service, it’s data,” she says. Previously, retrieving that information would require effort that wasn’t always possible in the day-to-day. Now it’s easy to see those KPIs at a glance. “And it doesn’t take that time,” she enthuses. “I don’t have to question if I’m being effective in what I’m doing. I can look and see that I’m being effective. And if I’m not, then I know I need to make a change.”
“Tessitura Analytics brings a lot of validity to the work that we do. And it’s not just lip service, it’s data.”
— Denise Smithson Green
Making data meaningful
At Baltimore Center Stage, “We’re excited about Analytics because we’re able to take all of that information and make it meaningful,” says Madeline Dummerth, Database Coordinator.
For example, Dummerth created an indicator that made it easy to view the organization’s progress towards its single-ticket goals. Previous reporting had largely focused on overall goals, so a visual indicator of more specific goal “was pretty cool,” she said.
Board reporting is another example, “You can give a board report that’s an Excel spreadsheet, and they’ll glaze over and not have any idea what they just looked at,” Dummerth says. “But with Analytics, we’re able to do some visualization that makes it a lot more meaningful.”
Dummerth believes that Tessitura Analytics will “help us understand our customer journey. We’re all using the platform and we’re all talking to the same customers, but in different ways. And so the goal would be to make sure that we’re giving every single patron the journey that they want and need, as opposed to what we think that they want and need.”
“We’re excited about Analytics because we’re able to take information and make it meaningful.”
— Madeline Dummerth
Underpinning that goal is the ability to analyze cross-departmental information because of the unified Tessitura platform. “Tessitura and its unified system is absolutely helping us to move in that direction,” Dummerth says, “to create that journey” for their patrons.
Better collaboration through data
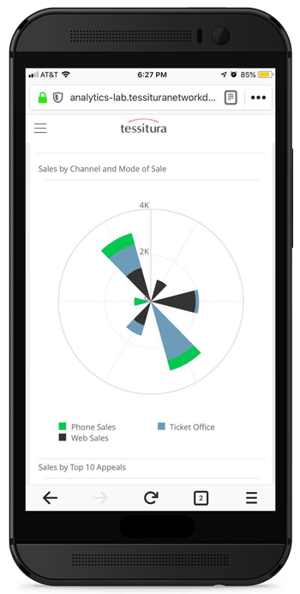
An example of a Tessitura Analytics dashboard viewed on a mobile phone
Like Dummerth, Heath Wilder, CRM and Ticketing Manager at Sydney Dance Company, has found Tessitura Analytics a valuable tool for increasing executive buy-in. “I’ve got a bit of a mission statement this year, and that is to provide data to every part of the organization,” he says. Tessitura Analytics offers “very interactive kind of pieces of data, which is good for [our executive director], our board, our executive team, as well as those of us who just want to explore a bit more.”
In that spirit of exploration, Wilder has held roundtable conversations with staff to learn about their real-life needs and collaboratively devise solutions. In one of those conversations, the box office and front of house teams expressed the need for actionable information about unused seat holds.
Seat holds for donors and prospects can be a key point of collaboration — and sometimes contention — between the ticketing and development teams. Wilder created a report that shows all unused development holds at a glance, organized by performance and seating zone. The chart offers an easy way for the ticketing team to see those holds, and opens the door for those staff to reach out and check with the development team about what seats, if any, can be released for sale. The transparency of the data eases the way to better collaboration.
At Sydney Dance Company, the transparency of the data eases the way to better collaboration.
Wilder notes that working with a unified platform is fundamental to taking control of your data, which in turn leads to smoother communication. “We get to keep all of that information — education stuff, development stuff, ticketing stuff, all our relationships — in one place, so we can then communicate better or have a conversation outside of Tessitura, outside the database itself.”
Better access to information
At Arts Commons in Calgary, Alberta, the ticketing and front-of-house teams are enjoying better access to their data. Jen Jamer, Manager of Ticketing Services, says: “One of the most common questions I get is how many accessible seats are expected to be used for any given performance.” So she created a report that tracks usage of accessible seating usage in their large concert hall. “I set it up so it would be a one-time filter,” Jamer explains, so that performances that get added throughout the season will automatically populate in the report.
“We now have one report that the house managers can access easily prior to their pre-show chat to inform ushers of exactly how many and which seats are expected to be used in the accessible section of the theatre,” Jamer says. As a bonus, this report can be duplicated for future years by simply adjusting the filters. Plus, she adds, “you can share the report with other Analytics users or even schedule the report to be sent by email at the frequency of your choice.” While these teams had access to this information before, it’s now available in an easier-to-read format, and more readily shared among key staff.
Making dynamic pricing easier
Jamer has also used Tessitura Analytics to streamline the team’s workflow for dynamic pricing. She has set up tracking that takes into account the different thresholds for various performances, and then sends out notifications via email or mobile phone to let staff know when a show has reached the threshold to increase prices.
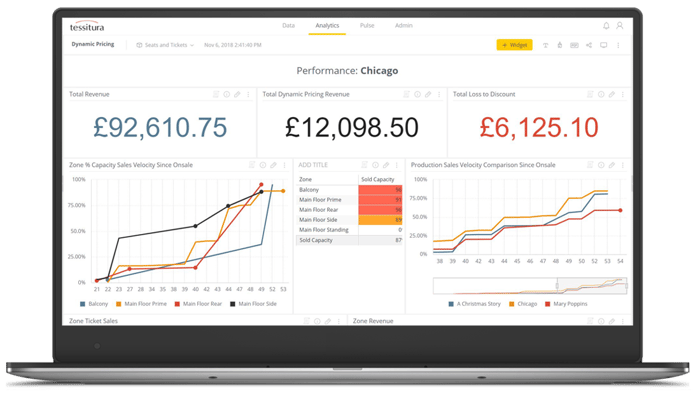
An example of a dashboard to monitor thresholds for dynamic pricing changes
“You can customize notifications to go to the appropriate people for follow-up action, and even add a message to the notification they get,” Jamer explains. “I love the fact that you just set them, forget them, and you get an email when it’s time to do your increase.” Now that these notifications are set up for the entire season, “We will not need to run nearly as many reports to track sales and dynamic pricing opportunities,” saving time over the course of the year.
Now that Arts Commons has been on Tessitura for ten years, Jamer reflects: “The system that we were using previously, which was a third party vendor, they told us how to sell our tickets. This way, we get to decide how we’re going to sell our tickets, how we’re going to engage with our patrons, what we’re going to offer, how we’re going to offer it.”
Jamer appreciates that Tessitura provides organizations “the ability to chart their own course.” That means, she says: “The successes and failures are their own to have. Sometimes you’re going to make the wrong decision. But we’re deciding it as a team rather than having somebody else say, ‘Well, the system doesn’t do that, so we’re deciding for you.’”
Tessitura “gives us so much more flexibility and the ability to make our own decisions, decide our own destiny,” Jamer says.
Tessitura “gives us the ability to make our own decisions, decide our own destiny.”
— Jen Jamer
It’s a similar sentiment to what Smithson Green expressed. “We really can see our work and how it’s paying off,” Smithson Green explains. Now that Des Moines Performing Arts have brought their data and their business intelligence tools in house, “it’s really opened our eyes to how effective we’re being as an organization.”
Growing sustainability
Kyle Jarvis of Somerset House in London agrees. “I think the biggest benefit for Somerset House has been being able to take control of our data,” he says. Before they began using Tessitura, each department ran its own operations on different platforms. “Now everyone’s ticketing through Tessitura, so everyone can see the data.” While it seems simple, it’s been revolutionary to easily see when patrons attend different types of events. “This data is ours, and we’re able to see who our audiences are,” Jarvis enthuses.
That information is also important for long-term sustainability. “As the market becomes much more competitive, there’s more people out there,” Jarvis notes. “Times are harder as well, so people don’t have as much money. So it’s really useful to see who it is we’re talking to and see who comes in. Regaining control of your data is the big benefit.”
“Regaining control of your data is the big benefit.”
— Kyle Jarvis
Data and reporting have become too important in today’s world to leave in someone else’s hands. If you don’t have easy access to your key metrics, you’re missing daily opportunities to adjust your course. And if you don’t have the tools at hand to create easy solutions to day-to-day problems, you’re potentially making your team work harder than they need to. It’s vital to have the business intelligence tools to serve the the day-to-day needs of your team — and, more importantly, helping you meet the long-term goals of your organization.
Take your data into your hands and decide your own destiny.
Topics
BI & Analytics
/Business Strategy
 Insights and Innovation
Good data is about people
Arts & Culture / BI & Analytics / Technology
How data is fueling the future of arts and culture (and why Tessitura members have an edge)
 Insights and Innovation
The audacity of relevance
Arts & Culture / Innovator Series / Community Engagement
Alex Sarian urges us to prioritize shared cultural experiences in the face of social isolation
 Insights and Innovation
Who we are, what we value and where we’re headed
Arts & Culture / Technology
Recapping the TLCC Orlando 2023 opening session